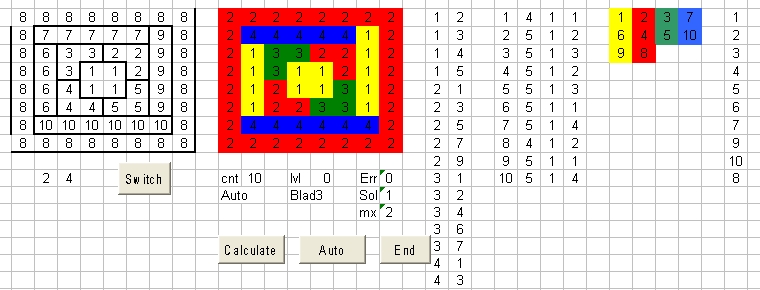
- The Left part contains the Target Map and one Command Button: Switch.
- The Center part contains 4 command buttons: Calculate , Mode End and Wait.
The Center part also contains five program parameters, discussed below. - The Right part is divided in 4 sections and contains the intermediate results of the program. For more info see below.
Picture 1 |
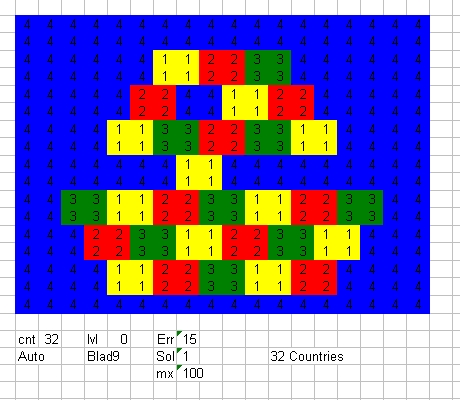
- The Left Map is called the Target Map and shows the layout of all the countries used. Each country is identified with a number. The primary purpose is to define each country and draw the borders of each country.
- The Center Map is called the Result Map and also shows the layout all the countries but now each with its own calculated color.
- The Calculate button is used to perform a simulation and to calculate, based on the Target Map drawn, the actual colors in the Result Map.
Before the Calculate button it is important to select the Mode button. - The Mode button has four values or modes: "Continuous", "Auto", "Manual" and "Step".
- The normal mode is the "Auto" mode. When the "Auto" mode is selected and the Calculate button is selected the simulation will start and slowly each country will given a color.
when the complete map is colored the calculation will show the End button and the Wait button button. This defines one solution.
However the simulation is not finished
You have now two options. They are important.- When the the End button is selected the program will terminate. When finshed the program will show the Calculate and "Auto" Mode button.
- When the Wait command button is selected a next solution will be calculated.
When the "Manual" Mode mode is selected each time when the level parameter is increased the calculation will go into the "Wait" state.
- The Step mode is the most accurate mode to investigate what the calculation does. After each step the calculation
- There is also an extra mode called the Continues mode. When this mode is selected the calculation will go through all the possible solutions, without stopping.
- The normal mode is the "Auto" mode. When the "Auto" mode is selected and the Calculate button is selected the simulation will start and slowly each country will given a color.
- The End mode button is used to terminate the simulation. The End command button is direct displayed after the Calculation command is selected and is normally used in combination with the "Auto", "Manual" and "Step" Mode button in combination with the Wait button.
The End mode button can also be used in combination with the "Continuous" Mode button to terminate this simulation. To stop such a simulation is not easy. The End mode button has to be used at least twice. The first time the 5 parameter display area will display STOP. The second time the simulation will terminate. - The Switch mode is only important for the target map. The command is used to change two country numbers. Near the Switch button two parameters are displayed.
When these two parameters are for example 2 and 4 and the Switch command is selected then each cell which contains a 2 is changed in a 4 and vice versa. When the Switch command is selected again (no parameter change) the original situation is restored.
Changing county numbers can have influence about the actual solution calculated.
Parameters of the program
The program uses 5 parameters: cnt, lvl, Err, Sol and Max- The parameter cnt shows the number of countries colored in progress. The final number should be the same as the number of countries.
- The parameter lvl shows the number of levels in the recursive subroutine Maximum2. See below in the section: Excel Program description
- The parameter Err shows the number of errors detected. Normally this means that there currently is no solution. Normally this means that the subroutine Maximum2 terminates, countries are cleared and continues at a lower level.
- The parameter Sol shows the number of solutions counted. In the "Auto" mode this value is 1 when the program finds a solution. In the "Continues" mode this value slowly increases.
- The parameter Max defines the maximum number of solutions accepted. This value is only used in the "Continues" mode. When the The parameter Sol reaches the parameter Max value, the program stops.
- A Copy of mode of the Mode command button.
- The parameter name. This is name of the active "Blad". Normally the parameter name is the name of the selected "Blad".
When Blad7 is selected the parameter name shows Blad7. This is also the case when Calculation button is selected. However when during this calculation a different "Blad" is selected, for example Blad8 then parameter name of Blad8 will show Blad7 and not Blad8, because the calculation started with Blad7 is not finished. - The parameter STOP after the End button is selected during a running simulation
The right side of the display.
The right side shows the results of each simulation and is subdivided in 4 sections.Section 1 consists of 2 columns. Section 2 of 4. Section 3 of 4 and Section 4 of 1.
- Section 1 shows the country numbers which surround each country.
When there are n countries Column 1 shows the numbers from 1 to n.
Column 2 shows first the country numbers which surround country 1. Next the country numbers which surround #2 etc until country n.
Section 1 shows an important rule. If one country is surrounded by three countries they should have the color numbers 1,2,3 and 4. - Section 2 shows the most important information as the simulation progresses.
Column 1 shows the country # from 1 to 4. Column 2 shows the number of countries that surround a specific country. Column 3 shows the number of colors that are availble for a specific country. Initial this value is 4.
When for a certain country a specific color is selected this value changes to 1 and the total number of available colors for the surrounded countries is decreased by one. Column 4 contains the final color number. - Section 3 shows the final country numbers for each country.
Column 1 shows the country number for color 1 i.e. yellow. Column 2 shows the country number for color 2 i.e. red. Column 3 shows the country number for color 3 i.e. green. Column 4 shows the country number for color 4 i.e. blue. - Section 4 shows the final order of the countries as filled in.